BCWMC Capital Improvement Project Projects
Map Controls
Address Search
Filter Projects
Filter by Status
Keyboard Navigation Help
- Tab: Navigate between map controls and project markers
- Enter/Space: Activate buttons and open project details
- Arrow Keys: Pan the map when map is focused
- Plus/Minus Keys: Zoom in and out when map is focused
- Escape: Close open popups
Flood Control Project
Background and Map of Flood Control Project Features
2025 Feasibility Study: Double Box Culvert Repair Project
2024 Bassett Creek Double Box Culvert Inspection Report
2020 Deep Tunnel Inspection & Mississippi River Drawdown
Project List
Bassett Creek Valley
Stakeholder Reconvening Meeting, September 27, 2023
Presentations:
Initial Stakeholder Summit, March 29, 2023
Presentations:
Floodplain & Stormwater Management Study, December 2019: Study fact sheet | Full study document
Crystal
- Bassett Creek Park Pond & Winnetka Pond Dredging Project
- Construction Year: 2019
- North Branch Bassett Creek Restoration Project: 200 Feet Upstream of Douglas Drive to 32nd Avenue North
- Construction Year: 2012-2013
Golden Valley
- Bassett Creek Restoration Regent Ave. to Golden Valley Road
- Anticipated Construction Year: 2026
- SEA School - Wildwood Park Flood Storage Project
- Construction Year: 2023
- Medley Park Stormwater Treatment Facility
- Construction Year: 2022
- Sochacki Park Water Quality Improvement Project
- Anticipated Construction Year: 2026
- Main Stem Lagoon Dredging Project
- Construction Year: 2022/2023 & 2027/2028
- Sweeney Lake Water Quality Improvement Project
- Implementation Year: 2020-2021
- DeCola Ponds B and C Improvement Project
- Construction Year: 2019
- Honeywell Pond Enhancement/Improvement Project
- Construction Year: 2017
- Twin Lake Alum Treatment
- Treatment Year: 2015 with the possible second treatment in future
- Schaper Pond Diversion Project
- Construction Year: 2015
- Bassett Creek Main Stem Restoration Project 2015CR: 10th Avenue to Duluth Street
- Construction Year: 2015
- Briarwood/Dawnview Water Quality Improvement Project
- Construction Year: 2015
- Bassett Creek Main Stem Restoration Project: Wisconsin Avenue to 10th Avenue and Duluth Street to the Crystal Border
- Construction Year: 2012-2013
- Wirth Lake Outlet Structure
- Construction Year: 2012
- Bassett Creek Main Stem Restoration Project: Crystal-Golden Valley Border to Regent Avenue
- Construction Year: 2010-2011
Medicine Lake
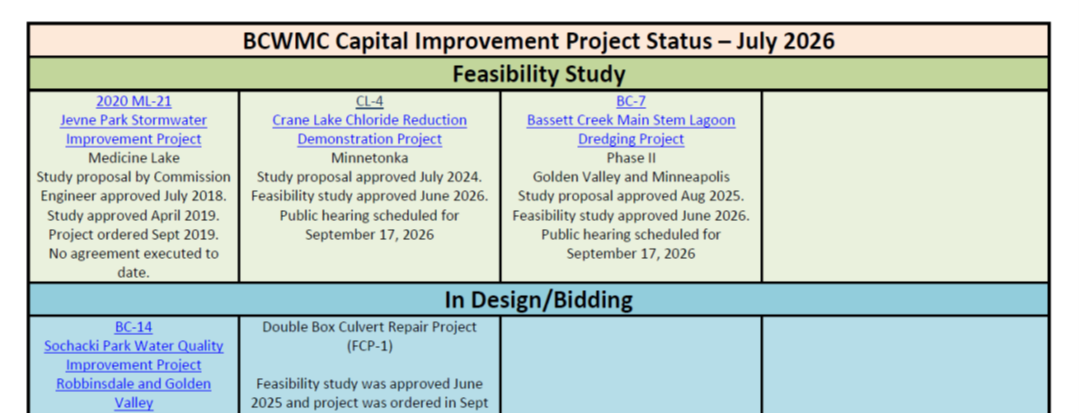
Jevne Park Stormwater Improvement Project
Construction Year: On Hold
Minneapolis
- Bryn Mawr Meadows Water Quality Improvement Project
- Construction Year: 2023
- Main Stem Lagoon Dredging Project
- Construction Year: 2022/23 & 2027/28
- Bassett Creek Main Stem Erosion Repair Project: Cedar Lake Road to Dupont Avenue North/ 2nd Avenue North, plus Fruen Mill Area
- Construction Year: 2020-2021
- Bassett Creek Main Stem Restoration Project Golden Valley Rd. to Irving Ave.
- Construction Year: 2014-2015
Minnetonka
Crane Lake Chloride Reduction Demonstration Project
Construction year: 2025/2026
Crane Lake Improvement Project
Construction Year : 2020
New Hope
- Northwood Lake Improvement Project
Construction Year: 2016
Plymouth
Anticipated Construction Year: Phase I: 2026
Construction Year: 2024
- Four Seasons Water Quality Improvement Project
Construction Year: 2024 - Parkers Lake Drainage Improvement & Chloride Reduction Project
- Mt. Olivet Stream Restoration Project
- Plymouth Creek Restoration Project: Annapolis Lane Upstream through Plymouth Creek Park
Construction Year: 2018
Construction Year: 2010-2011
St. Louis Park
Construction Year: 2020
Robbinsdale
Sochacki Park Water Quality Improvement Project
Anticipated Construction Year: 2026
CIP Information
BCWMC Capital Improvement Program
BCWMC's CIP Process Flowchart and Timeline
CIP Prioritization Matrix | CIP Prioritization Maps
Street Sweeping Prioritization
2025 Street Sweeping Prioritization Project Final Report
Hydrologic Modeling Project
Fact Sheet: XP-SWMM Project & New Flood Elevations
XP-SWMM Phase II Final Report (August 2017)
Appendix A ‐ Comparison of BCWMC Historic Flood Profiles to the Phase 2 XPSWMM Model Results (August 2017)Phase 2 XPSWMM Model Results (August 2017)
XP-SWMM Phase II Project Overview Presentation (January 2017)
XP-SWMM Phase II Project Budget and Timeline (April 2015)
Pond Prioritization Project - 2017
P8 Model Extents Map - Shows individual drainage areas included in each model. Can be viewed as key for nomenclature on other files.
Pond Performance Map - Shows overall results of prioritization process with high, medium and low priority ponds for entire watershed.
Pond Ranking Table - Spreadsheet with all pertinent P8 model results used to develop and rank/map prioritized ponds. Includes links of pond rankings to each city (in ‘MS4’ column) for sorting.
Following maps show results for each major drainage area in a color scale depicting where highest runoff TP concentrations are being delivered downstream. Red-shaded subwatersheds delivering flow to a receiving water represent highest priorities for future BMPs, while the green-shaded areas likely indicate good BMP treatment already exists.
Medicine Lake Direct | Medicine Lake NE | Medicine Lake North
Medicine Lake South | Northwood-Bassett Cr Park Pond
Parkers-East Parkers | Plymouth Creek | Sweeney-Twin Lake